
Case Study 1: The search for key players in ecological food webs
Pyntacle version: 1.0
Table of Contents
- Introduction
- Data Description
- Assessing the importance of species using single-node-resolution centrality
- Key player search (kp-search) in food webs: species reachability (m-reach)
- Key player search (kp-search) in food webs: species fragmentation (F)
- Comparison of the Mauritania findings against the Erdős–Rényi model
- Conclusions
Note to the reader: the purpose of these case studies is not scientific, but demonstrative of the functionalities of Pyntacle.
Introduction 
This case study will show how to determine key players and group effects in food webs. It will not describe the theory behind the key-player metrics developed in Pyntacle. The interested reader may in fact refer to What Are Key-players section for detailed explanation of the key-player metrics, to the Quick Startup Guide for getting acquainted with the basic Pyntacle commands, to the Pyntacle Library and to the Pyntacle Python’s API.
Food webs represent trophic relationships among species and are increasingly used to integrate ecological data and to determine ecosystem properties. Some species, like earthworms, beavers or the krill, have large effects on others. These play an extraordinarily important role in the ecosystem where they live and occupy crucial positions within the inter-specific interaction networks (for example, in the food webs). For this, they are called keystone species (Jordan, 2009). Identifying keystone species is also important in conservation management. One way to do that is through network theory (Harary 1961, Jordán et al. 1999).
In a network perspective, nodes in a food web are organisms (species or their larger groups). Links among nodes represent feeding relationships. The direction of links is not considered here: although materials flow from resource to consumer, ecological effects (e.g. control) flow in both directions. The weights on links (how much material is transfered) is also not considered here, although typically this information is available and can be used for other kinds of analysis, such as to detect differences in species consumption rates (see (D’Alello,2016). The sign of links is implicitly clear (positive from resource to consumer and negative from consumer to resource), but also not considered here. So, this case study will deal with a binary, symmetrical and unsigned graph representing the Mauritania Food web (described in the next section). It will be first analyzed locally, namely the centrality of key species (nodes) will be assessed by node centrality indices, and later collectively by the Pyntacle’s key player metrics, to capture their eventual group effects. We will then compare the two analysis results between them and with those obtained with a null model created using pyntacle generate, the network generator that recreates in silico graphs that follow predefined and well-known topologies.
In brief, the case study will follow this scheme:
- Assess the importance of species in the food web using single node centralities obtained through
pyntacle metrics local; - Search for node sets that maximize a key player rechability index, m-reach, a proxy for node connectivity, using the
pyntacle keyplayer kp-finderutility; - Find core species whose removal in the food web disrupt network connectivity using a fragmentation key player metric, F;
- Compare the changes in the fragmentation index of the food web agains a random (null) model created using the
pyntacle generatecommand;
This analysis was inspired by our publication on food web topologies done in collaboration with the Network Ecology team of the Danube Research Institute in Budapest led by Prof. Jordàn, which we thank for the support and the huge aid in writing this case study.
All the starting data and the corresponding results can be downloaded at this link.
Data Description 
The data from this case study is the Mauritania food web, a network describing trophic relationships among marine species in the Exclusive Economic Zone (ZEE) of Mauritania sea territories. It has been firstly described in the 2004 Fisheries Centre research Report (Chapter 4: Modèle écotrophique de la ZEE mauritanienne: comparaison de deux périodes (1987 et 1998))
It is made by 37 organisms (N = 37) and 284 feeding interactions among organisms (E = 284). Nodes depict marine species, whose names are described in the following table:
| Species ID | Species Full Name |
|---|---|
| Orq | Killer Whale |
| Dauph | Dolphin |
| Ois | Sea Birds |
| SelLPred | Large selachians - predators |
| SelLInv | Large selachians - invertebrates |
| RaieM | Small rays |
| ThonHau | Deep-sea tuna |
| ThonCot | Coastal tuna |
| MesoPred | Mesopelagics - predators |
| MesoInv | Mesopelagics - invertebrates |
| BathySPred | Bathydemersals - predators |
| BathySInv | Bathydemersals - invertebrates |
| Merlu | Hake |
| Spar | Commercial sparids |
| DemLPred | Large demersals - predators |
| DenLInv | Large demersals - invertebrates |
| DemMPred | Medium demersals - predators |
| DemMInv | Medium demersals - invertebrates |
| DemSPred | Small demersals - predators |
| DemSInv | Small demersals - invertebrates |
| Mugi | Mugilidae |
| Sabre | Saberfish |
| PelLPred | Large pelagics - predators |
| PelDInv | Large pelagics - invertebrates |
| PelMPl | Small pelagics - planktivores |
| Maq | Mackerel |
| Clup | Clupeids |
| Chinch | Horse Mackerel |
| CephaCom | Commercial cephalopods |
| CephaNonCom | Non-commercial cephalopods |
| MacroBenth | Marcrobenthos |
| CrusCom | Commercial crustaceans |
| CrusNonCom | Non-commercial crustaceans |
| MacroZoopl | Macrozooplankton |
| MesoZoopl | Mesozooplankton |
| MicroZoopl | Microzooplankton |
| ProdPrim | Primary producers |
The network file has already been symmetrized and the trophic weights have been removed to make it compliant to the Pyntacle minimum requirements. The network is stored in a text file, which is a binary adjacency matrix with labels. It can be downloaded from here.
For a detailed description of the adjacency matrix file format, have a look at our file formats guide.
Assessing the importance of species using single-node centrality 
Assessing the importance of nodes in networks is possible by several centrality indices. In Ecology, this problem was faced by Paine, 1966 and Bond, 1993. A set of local topological indices are implemented in Pyntacle and the way to calculate them is as simple as typing on your shell:
pyntacle metrics local -i mauritania.adjm -d ./
where the -i argument is the path to the input adjacency matrix and -d is the directory that will store Pyntacle results. From here onwards we assume that Pyntacle is running on the same directory that stores the input file, and that the results are stored in the same directory (you can tune these settings as you please). Note that in this case we are asking for the centrality indices of all the nodes in the network. Users can alternatively opt-in to compute these indices for a selected subset of nodes by means of the --nodes argument, passing a comma-separated list of the desired nodes. A complete list of all the arguments existing for each Pyntacle commands is available in the Pyntacle command line guide on our website.
In the results Pyntacle will produce a report, in tab-separated format, storing all the computed local metrics. The name of the file will contain a prefix (e.g., Report_mauritaniaLocal) and a suffix with the analysis execution date and time (e.g., 2018-08-09-175151). Optionally, the user may opt to generate the report in a comma-separated format or as an Excel spreadsheet, by assigning csv or the xlsx string to the -r/--report-format argument. The report will contain a first part continaing some details on the input network:
| Network overview | |
|---|---|
| Graph name | mauritania |
| Number of Components | 1 |
| Nodes | 37 |
| Edges | 284 |
This part is common to all Pyntacle text reports and gives a quick overview of our input graph, serving both to generally describe the network and to check that the network was correctly imported by Pyntacle i/o methods.
The second part of the file will report the centrality metrics of all nodes in the network. This is a brief extract sorted (descendent) by degree.
| Node Name | degree | clustering coefficient | betweenness | closeness | radiality | radiality reach | eccentricity | eigenvector centrality | pagerank |
|---|---|---|---|---|---|---|---|---|---|
| MesoZoopl | 26 | 0.43077 | 3.632.218 | 0.78261 | 272.222 | 272.222 | 2 | 0.25339 | 0.04346 |
| Clup | 23 | 0.4585 | 2.116.752 | 0.73469 | 263.889 | 263.889 | 2 | 0.23303 | 0.03842 |
| MacroBenth | 23 | 0.41107 | 282.863 | 0.73469 | 263.889 | 263.889 | 2 | 0.21943 | 0.0389 |
| Dauph | 22 | 0.4026 | 2.418.003 | 0.72 | 261.111 | 261.111 | 2 | 0.21513 | 0.03722 |
| Chinch | 22 | 0.50649 | 1.794.588 | 0.72 | 261.111 | 261.111 | 2 | 0.22828 | 0.03688 |
| CephaCom | 22 | 0.48052 | 1.839.216 | 0.72 | 261.111 | 261.111 | 2 | 0.22571 | 0.03689 |
| SelLPred | 21 | 0.5 | 193.058 | 0.70588 | 258.333 | 258.333 | 2 | 0.21318 | 0.03574 |
| PelLPred | 20 | 0.45789 | 1.672.675 | 0.69231 | 255.556 | 255.556 | 2 | 0.20158 | 0.0342 |
Additionally, Pyntacle will draw the graph and will save it in the pyntacle-plots subdirectory of the main folder of the project as a PDF file.
Here the Mauritania food web:
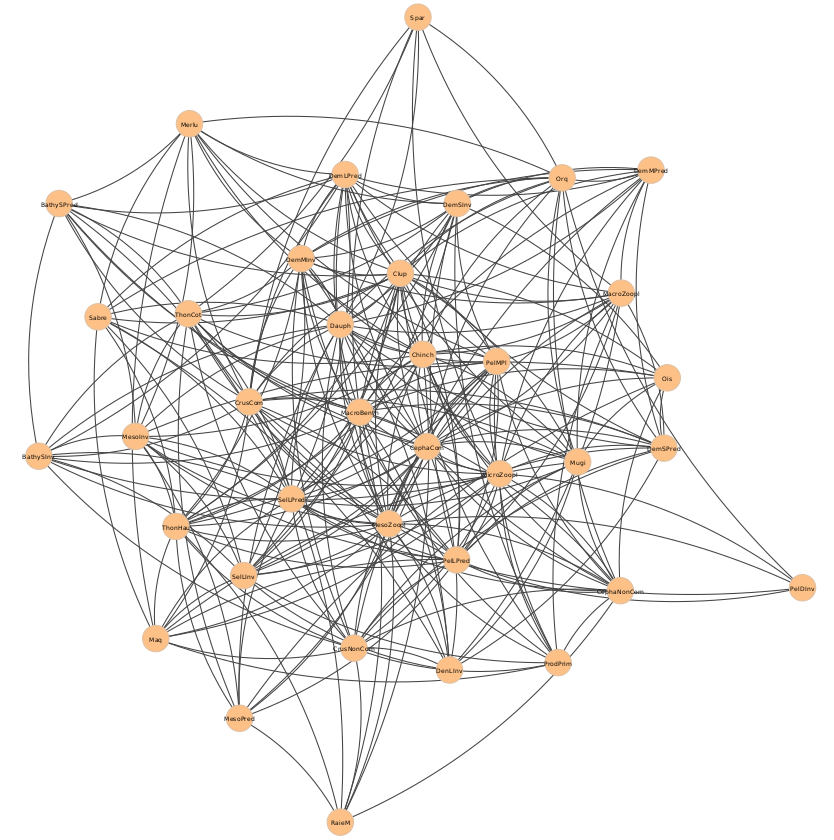
Local centrality analysis pinpoints MesoZoopl, an ensemble of mesozooplankton species such as chaetognathes and meroplankton, as the node with the highest degree, so the greatest number of connections with all other species in the Mauritania food web. This is reasonable, considering that plankton is widely used by other species as a first nourishment.
It can be noted, however, that several other species exhibit very close degree values and, thus, that the degree alone might not be sufficient to identify keystone species in this food web. Similarly, other topological metrics like the clustering coefficient and betweenness suffer from the previous drawback, other than failing to capture any joint effect of groups of nodes. The concept of group importance can be exploited instead by means of group centrality measures, such as the key player indices.
Key player search in food webs: reachability (m-reach) 
While local centrality measures can be good indicators of the position and immediate connectivity of nodes in networks, little information is currently obtainable on the directly or indirectly reached nodes by another node. A single node may in fact be able to reach (i.e., be connected by one or more links with) all other nodes in a network, or this may be possible if considering all reached nodes by a team, i.e., a group, of nodes. Identifying the smallest group of nodes that achieve this goal is equivalent to finding the key players of a network.
We will hence search here for the species in the Mauritania food web that reach their most partners by a limited number of links through a trophic network using the kp-finder command in the pyntacle keyplayer suite. In this context, the m-reach key player index well fits our needs: m-reach counts the number of nodes that are reachable by a set k of nodes in m links or less. For a more detailed description of the m-reach, we refer the reader to the What are Key-players and the Quick Start Guide sections.
The m-reach calculated on a set of size 1 (k=1) and a maximum distance of 1 (m=1) corresponds to the node degree. We can prove this in our case study food web by executing the kp-info utility of the pyntacle keyplayer command, that computes key player indices of choice for a specific set of nodes. If we want to check this on the MesoZoopl node, we could run the following command on our shell:
pyntacle keyplayer kp-info -t mreach -m 1 -i mauritania.adjm --nodes MesoZoopl -d ./ --no-plot
Pyntacle shell output will show information on how the run performed and will produce, among other informations (not reported here for readability), the following summary:
****************************************** RUN SUMMARY *******************************************
The mreach of node set:
(MesoZoopl)
is 26 on 37 (number of nodes reached on total number of nodes)
This means it can reach the 72.973% of remaining nodes in the graph nodes in at most 1 steps
***************************************************
And report the results.
Although m-reach matches the node degree of MesoZoopl and confirms it being the most immediately connected species, The two metrics carries a different meaning. M-reach in fact adds to the degree that MesoZoopl it is able to reach alone almost all other nodes, i.e., 26 nodes out of 37, which is almost the 73% of the whole food web population.
Along with all the other key player indices, m-reach can be used to rather infer the effect of groups of nodes of greater size rather than singletons in the network. Moreover, instead of finding the a priori value for a set of nodes, one could be interested in finding this set by means of key player indices. Furthermore, it may be possible that there is no single solution to this problem, but rather a collection of solutions, so multile sets of nodes that have the same m-reach value, hence the same impact on the network reachability by a key player perspective. Finally, Note that MesoZoopl may not be included in the optimal key-player set of size 2 since other combinations of nodes may reach the same number of nodes, or even a greater percentage of them.
To this extent, Pyntacle can be run again in search of an optimal group set (or sets) of size 2 that maximize m-reach by means of a brute-force search that explores all the space of solutions and returns all the node sets that achieve the best m-reach value. This approach may take a long time on big graphs (over $10^3$ nodes), but it is fast enough on small networks like this food web.
Without changing the maximum distance by m-reach, the answer to this question can be obtained typing:
pyntacle keyplayer kp-finder -t mreach -k 2 -m 1 -I brute-force -i mauritania.adjm
that will return the following output
****************************************** RUN SUMMARY *******************************************
Node set size for key player search: 2
****************************************************************************************************
Key player sets of size 2 for positive key player index m-reach, using at most 1 steps are:
(Dauph, MesoZoopl)
(SelLPred, MacroBenth)
(Clup, MesoZoopl)
(Chinch, MesoZoopl)
with value 32 on 37 (number of nodes reached on total number of nodes)
The total percentage of nodes, which includes the kp-set, is 91.89%
****************************************************************************************************
(again, we will report here only the run summary and exclude the rest of the information)
As for the previous Pyntacle runs, this analysis will also produce a tabular report, that can be viewed at this link and the following plot in png format:
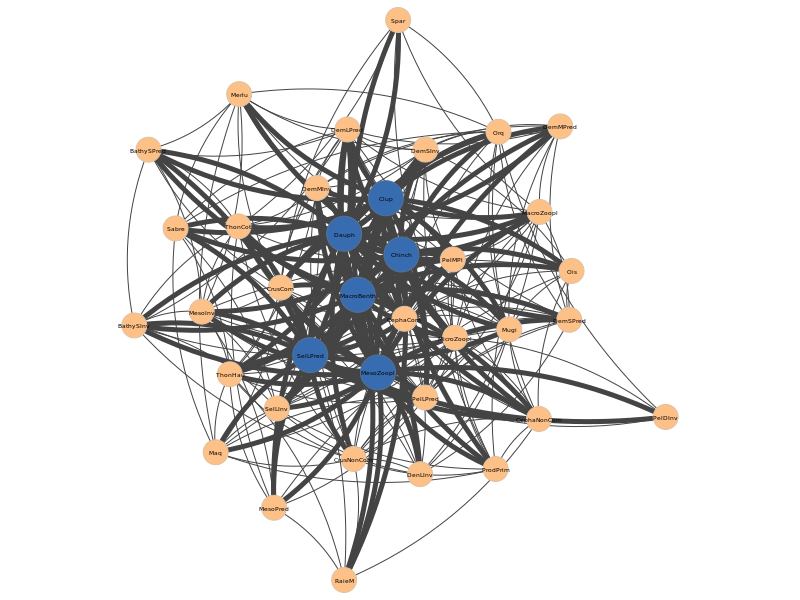
In this graph the nodes found for all m-reach node-sets of size 2 are depicted in blue, and an emphasis (strong line) is placed on the edges that connects the immediate neighbors (adjacent vertices) of each node found in this way.
If we look at the results, 4 sets made each of 2 species reach the vast majority of nodes in the network. 3 sets contain the MesoZoopl node, but the remaining set is made by SelLPred (Large selachians - predators) and MacroBenth (macrobenthos), two other species that have trophic interactions to the Meso zooplankton, and yet together have the same m-reach effect than MesoZoopl coupled with another species and never appear in combinations with it, which is quite interesting.
All the node sets have nodes that are ranked among the top 7 high degree nodes, with the exception of CephaComm (commercial cephalopods) is not present in any solution, despite having the same degree value (22) of Dauph and Chinch (22), which in combination with MesoZoopl are among the best node sets for m-reach.
These findings confirm that m-reach and degree, despite being semantically closer, show distinct and unique properties.
In the context of network ecology, m-reach allowed us to infer that the network inner topology makes it widely reachable by several species in it, as the distances among them are short enough to have short-range effects to all others.
In fact, 2 species are enough to reach most of the other nodes in the network, making the spreading of information of a food web (e.g.: the diffusion of a nutrient from a vegetable to a predator) very fast and with an immediate impact. Moreover, if we extend the m-reach distance to 2 (not shown here) we will see that the majority of species are single-handedlyis able to reach all the remaining ones. In that case, even a single node can reach all the other nodes in 2 steps (data not shown). In other words, the network is highly reachable when considering also indirect interactions.
We have explored here the reachability of a group of nodes and its impact on a food web. In the next section, we will explore another fundamental key player concept, fragmentation.
Comparison of the Mauritania findings against the Erdős–Rényi model 
The findings obtained in the previous paragraphs may be specific properties of the Mauritania network, or could occur by chance. To verify this, we wrapped from igraph and made available several generators of network models, such as the Erdos-Renyi random model in Pyntacle, under the pyntacle generate command.
We will hence create a random network with the same number of nodes and edges as the Mauritania food web to check if the key-player properties calculated for the food web could occur by chance. To create this model, type:
pyntacle generate random -n 37 -e 284
Where -n is the number of vertices and -e is the total number of edges. This edges are assigned randomly to node pairs, but preserving Pyntacle minimum requirements, so that the in silico network model can be reused by other Pyntacle methods.
The random model can be downloaded as adjacency matrix here.
The resulting network, when plotted, is the following :
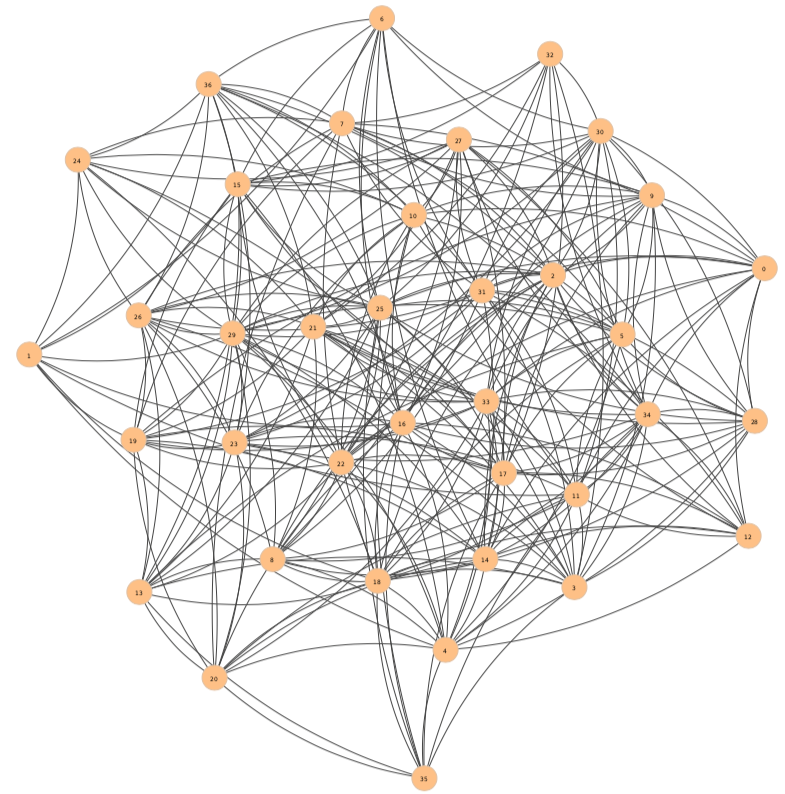
Note that the name of the nodes is a numerical index that is assigned randomly to each node from $0$ to $N-1$, where $N$ is the network size (number of vertices).
As done in the first analysis step, we will calculate the local indices of all nodes of the random network:
pyntacle metrics local -i mauritania_random.adjm --no-plot
If sort now the nodes by degree, ranking them from highest to lowest, we will notice that the 8 nodes with highest degree are lower than their rank equivalent in the Mauritania food web:
| Node Name | degree |
|---|---|
| 29 | 22 |
| 2 | 20 |
| 16 | 19 |
| 18 | 19 |
| 25 | 19 |
| 31 | 19 |
| 33 | 19 |
| 17 | 18 |
| 34 | 18 |
This is an excerpt of the full report produced by Pyntacle. The complete file can be downloaded here.
The degree value of the top-ranked degree node, named 29, is 22 and is lower compared to that of the MesoZoopl node in the Mauritania system, which is 26. This gives an idea of how single node centrality differs from a random model and how key species have a higher centrality, pinpointing their relevance in the ecological network structure.
Let’s now turn to the original reachability problem. Using our brute-force optimization algorithm, we determined that the maximum m-reach value for a set of 2 nodes, with $m = 1$, is actually made by several combinations of node pairs, that in turn exhibit high degree although not all the high-ranked degree nodes are part of these combinations. We can check if a random network behaves similarly by performing the same analysis on our random network, using the following command:
pyntacle keyplayer kp-finder -I brute-force -t mreach -k 2 -m 1 -i mauritania_random.adjm --no-plot
Looking at the tabular report produced (download it here ):
| Metric | Nodes | Value |
|---|---|---|
|m-reach| 29,34 | 33 |
The best set for m-reach is only one, with the percentage of nodes reached very close to the one observed in the Mauritania food web (94,5% percent of nodes reached in the random model vs the 91% reached by the 4 node sets of size 2 in the Mauritania food web). This proves that the Mauritania food web presents a higher number of key nodes when compared to a random model in terms of reachability.
Again, we try to perform a fragmentation analysis to check if the Mauritania network is particularly resistant to fragmentation when compared to a random model.
Execute on your shell:
pyntacle keyplayer kp-finder -t F -k 2 -i --no-plot
(It’s the same greedy optimization run performed before for the Mauritania model).
The report shows that, even here, there is no single node that can fragment the network:
| Metric | Nodes | Value |
|---|---|---|
| F | 6,34 | 0 |
Even here increasing the size of the k does not increase fragmentation (data not shown).
These results show that there is not any particular difference in fragmentation between the two networks and that the high resistance to fragmentation exhibited by the food web is the same than that of the random model, so this robustness might be a product of chance, and not a specific feature of the ecosystem.
Key-player search in food webs: fragmentation (F) 
In a key player framework,a set k of nodes that maximally fragment a network if removed and, thus, that increase the average diameter is known to have high fragmentation potential. Two fragmentation indices were implemented in Pyntacle: F and dF. We refer the user to out Introduction to Group Centrality to known the specifics of these metrics.
It is thus interesting in our case to use a fragmentation index as a proxy to search for “weak” niches of species among the Mauritania system, being “weak” an individual or a group of species that remain isolate when neighboring species are removed from the food web (in a mass extinction event, for example). To determine what are these vulnerable species, we will use the pyntacle keyplayer kp-finder command line tool to search for the set of nodes that cause network disruption by means of a greedy optimization strategy, that find the optimal (not necessarily the best) set of nodes of the same size of the brute-force search performed for m-reach in the previous paragraph ($k = 2$) that have the highest F index.
To do this, type on your shell:
pyntacle keyplayer kp-finder -k 2 -t F -i mauritania.adjm --no-plot
Which will produce the following output:
****************************************** RUN SUMMARY *******************************************
Node set size for key player search: 2
****************************************************************************************************
Key player set of size 2 for negative key player index F is:
(DenLInv, MesoPred)
Final F value: 0
Starting graph F was 0
****************************************************************************************************
And this text report
The greedy optimization returns a set of nodes (DenLInv and MesoPred) with a F value of 0. What does this mean? The F index varies from 0 (the graph has only one connected component) to 1 (the graph is formed by isolates). Being F a property of the graph, Pyntacle will first try to compute the starting F status of the graph and then will iteratively remove set of nodes of size k until it finds an optimal F value that maximizes the F. In our case, the initial F of the graph was 0, and no node set of size 2 could be found that creates at least two components, meaning that the food web topology is such that the removal of 2 species does not affect the network fragmentation. A brute-force run confirmed that there is no set of size 2 that maximizes the F (data not shown).
Moreover, only very large sets ($k > 8$) creates isolates and break the network, implying that the organization of the food web guarantees high stability of the network. So, we can speculate that the network is robust to changes in its node composition, to a certain extent.
To check if this robustness is an organizational property of the food web, and does not emerge randomly,we now compare these findings against an in silico network: the Erdos-Renyi Model, and check whether they are peculiar to this food web.
Conclusions 
The aim of this case study was to find the keystone species in the Mauritania network model. We first identified the species with highest degree centrality and demonstrated why the degree alone was not sufficient to determine the keystone species.
Through the Pyntacle node set search engines for key player indices, we showed how degree is not directly related to reachability. The highest degree node alone, MesoZoopl, was not sufficient to reach the whole network (assessed with the m-reach metric), but it needed to be associated to another high degree node to reach the highest number of species in one geodesic step.
Besides, MesoZoopl was not always necessary to reach the whole network, but other combinations of high degree nodes could do that. The same behavior was not observed in a random network where only one solution was found, thus remarking the fact that multiple species can together contribute to the overall network reachability.
When defining fragmentation instead, it is important to note that small node sets alone are not capable to fragment both the Mauritania food web and a random network of equal size. High-degree nodes, also in this context, are not said to have any fragmentation potential and, for this particular network, robustness to fragmentation seems hence a product of chance and not dependent on the intrinsic nature of the food web.
Of course, this conclusion cannot be generalized and it is speculative at best, since it should be proved more rigorously using more random networks and network models, such as the Watts-Strogatz Small-world model.
Moreover, please consider that the Mauritania food web has been symmetrized and unweighted, hence these results should not be strictly associated to the original network.
This concludes our case study 1. If you want to leave a feedback, please contact us. Any suggestion and critic is highly appreciated!